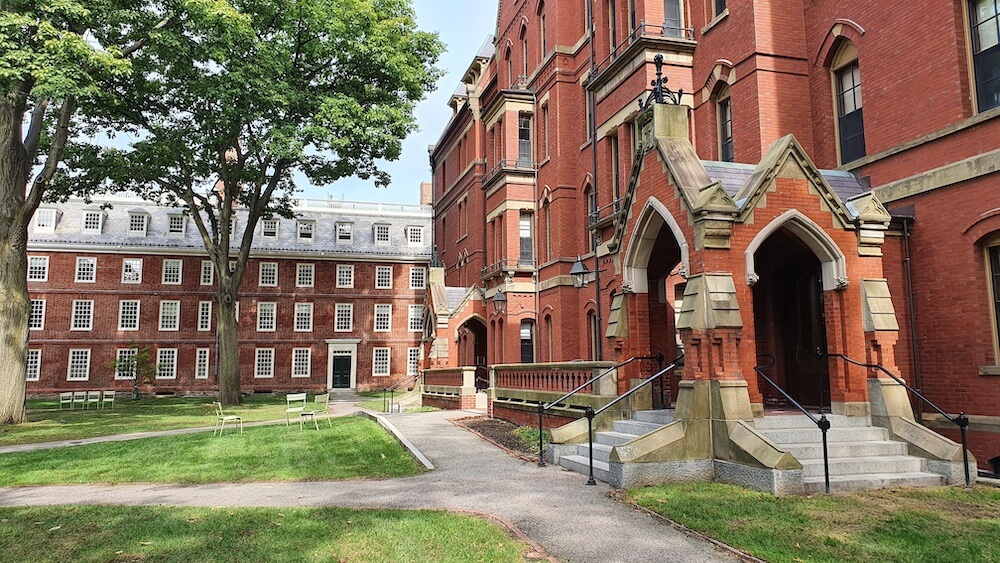
Having received a record number of applicants for the 2021-2022 school year, Harvard University hit their lowest acceptance rate of 3.43%, as compared to the previous year’s 4.5%. The Harvard Crimson conducted their annual freshman survey, to which 75% of students responded. Here are some findings from Part I of their four-part series.
The survey results demonstrate that Harvard’s class of 2025 is by and large affluent, white, straight, and hails from coastal regions. The Crimson found that 26% of students’ households make $250,000 or more per year, which is higher than 94% of U.S. households. However, while 45.1% of the respondents’ parents make more than twice the median household income in the U.S., 54.8% reported that they receive need-blind aid from the school, a 2.7% drop from the previous school year.
The study also found that a student’s family wealth is largely correlated to a student’s ethnic background–in contrast to 29.4% of Hispanic or Latinx students, 19.5% of Black or African American students, and 13.5% of Asian students, only 8.4% of the white demographic reported a combined income under $40,000. There was also a rise in the number of legacy students, who reported higher family income than that of their non-legacy counterparts. First-generation students reported lower family incomes than that of their classmates; 90.7% of first-generation students answered yes to receiving financial aid from Harvard. One-fifth of respondents reported having consulted private counselors on their college applications.
Another Ivy League university faces a similar dilemma of representation. Provost Richard Locke from Brown University has pointed out a lack of middle-income applicants, whose absolute number is much lower than that of students in the high and low-income brackets. A recent study found that low and middle-income students are under-represented at selective colleges as compared to students from upper-class families, even while holding test scores constant. In Locke’s words, they are accepted at a lower rate despite being just as competitive as their classmates; he did not give further explanation for this phenomenon.
Middle-income students are those who qualify for partial aid, but not enough to cover all costs. According to Brown’s Dean of Admissions Logan Powell, these students’ family contributions range from $10,000 to $30,000, while a “lower” income family making the 2020 U.S. median income of $67,521 would likely receive full coverage. Even families making up to $100,000 would usually not pay out of pocket. On the other end of the spectrum, however, are high-income students who have a 34% higher chance of attending elite colleges than lower-income students with the same test scores—19% of Brown’s class of 2013 came from households making $630,000 or more. As of 2021, the average net family contribution for Brown students is $28,000; at Harvard, the average is $12,000.
Highly-qualified middle-income students often find better offers from state schools or merit-based aid programs, pulling them away from “Ivy-plus” institutions. According to Professor Warikoo from Tufts University, however, favoring middle-income students in response to the systemic representation problem comes at the cost of other prospective students if the size of an incoming class is held static. In addition, expanding diversity also means expanding income diversity, which can come at a significant financial cost for universities. Locke disputes this assertion, arguing that Brown “accepts the best students from all income brackets.” Brown University assures that applicants are reviewed one at a time, and that no two applications are compared against each other.
As quoted from Brown’s Dean of Admission Logan Powell: “We are not making decisions solely on the basis of socioeconomic background. That’s a commitment we’ve had for a long time.”


